Hi Everyone, We are Back with a New Project. In this Project, We Use Iris Dataset for Exploratory Data Analysis.
Hi Everyone, We are Back with a New Project. In this Project, We Use Iris Dataset for Exploratory Data Analysis.
Necessary Library for this project,
These Libraries are Enough for EDA. Now Let's Start
import pandas as pd
import numpy as np
import seaborn as sns
import matplotlib.pyplot as plt
#Load Datasets
iris = pd.read_csv('iris.csv')
#check Shape of this project
print(iris.shape)
#Check Columns in this project
print(iris.columns)
#Check Species of Iris Datasets
print("iris['species'].value_counts()")
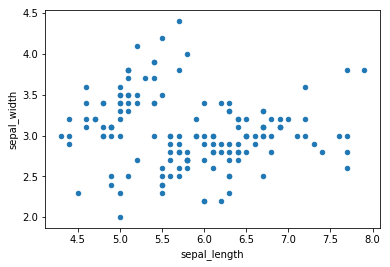
#Check Scatter Plot Between Sepal_length Vs Sepal_width
iris.plot(kind='scatter', x='sepal_length', y='sepal_width')
plt.show()
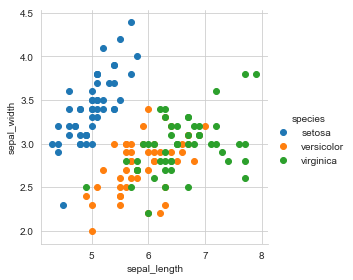
sns.set_style('whitegrid')
sns.FacetGrid(iris, hue='species',size=4) \
    .map(plt.scatter, 'sepal_length', 'sepal_width') \
    .add_legend()
plt.show()
plt.close()
sns.set_style('whitegrid')
sns.pairplot(iris,hue='species',size=3)
plt.show()

sns.FacetGrid(iris, hue='species', size=5) \ .map(sns.distplot, 'sepal_width') \ .add_legend() plt.show() Output:- 
counts, bin_edges = np.histogram(iris_setosa['petal_length'], bins=10, density=True)
pdf = counts/(sum(counts))
print(pdf)
print(bin_edges)
cdf = np.cumsum(pdf)
plt.plot(bin_edges[1:],pdf)
plt.plot(bin_edges[1:], cdf)
counts, bin_edges = np.histogram(iris_setosa['petal_length'], bins=20, density=True)
pdf = counts/(sum(counts))
plt.plot(bin_edges[1:], pdf)
plt.show()
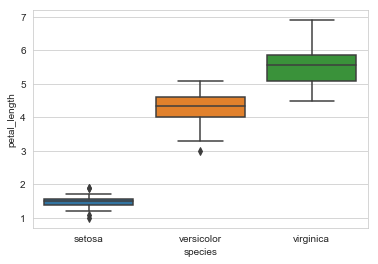
sns.boxplot(x='species',y='petal_length',data=iris)
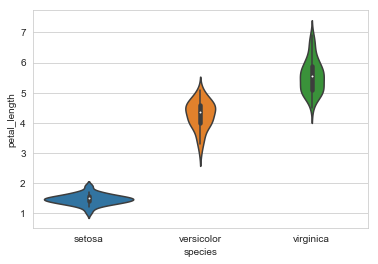
plt.showow()sns.violinplot(x='species',y='petal_length',data=iris,size=8)
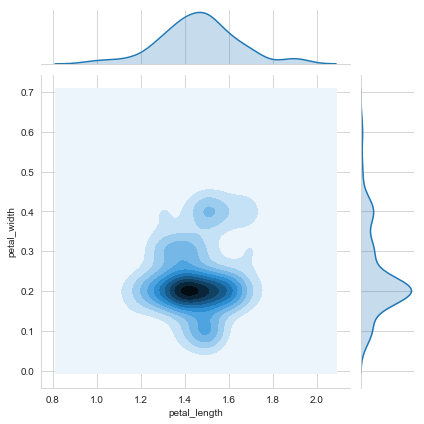
plt.show()sns.jointplot(x='petal_length',y='petal_width',data=iris_setosa,kind='kde')
plt.show()
Download Source Code
Thanks for Reading Share this Post
Sign in to join the discussion and post comments.
Sign in