Probability and Statistics - Interview Questions and Answers
In probability and statistics, a random variable is described informally as a variable whose values depend on outcomes of a random phenomenon. The formal mathematical treatment of random variables is a topic in probability theory.
The probability mass function, f(x) = P(X = x), of a discrete random variable X has the following properties:
- All probabilities are positive: fx(x) ≥ 0.
- Any event in the distribution (e.g. “scoring between 20 and 30”) has a probability of happening of between 0 and 1 (e.g. 0% and 100%).
- The sum of all probabilities is 100% (i.e. 1 as a decimal): Σfx(x) = 1.
- An individual probability is found by adding up the x-values in event A. P(X Ε A) =

Where Σ is summation notation. Read Full Details
1. In probability theory, conditional probability is a measure of the probability of an event occurring given that another event has occurred.
or
2. Recall that the probability of an event occurring given that another event has already occurred is called a conditional probability.
In probability theory, the chain rule permits the calculation of any member of the joint distribution of a set of random variables using only conditional probabilities. The rule is useful in the study of Bayesian networks, which describe a probability distribution in terms of conditional probabilities. - Read Full Details
Independence does not imply conditional independence: for instance, independent random variables are rarely independent conditionally on their sum or on their maximum.
Conditional independence does not imply independence: for instance, conditionally independent random variables uniform on (0,u) where u is uniform on (0,1) are not independent. - Read Full Details
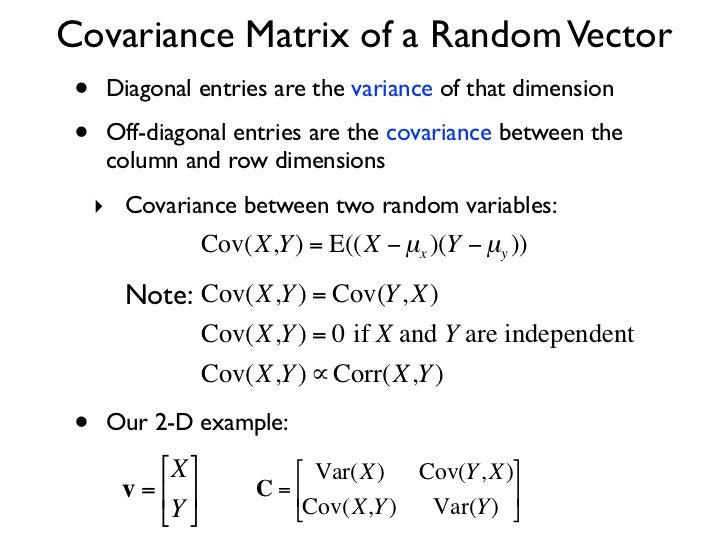
Given a random variable, we often compute the expectation and variance, two important summary statistics. The expectation describes the average value and the variance describes the spread (amount of variability) around the expectation. Variance refers to the spread of a data set around its mean value, while a covariance refers to the measure of the directional relationship between two random variables.
Probability is the study of predicting future outcomes based on a theoretical framework. It deals with the likelihood of events occurring.
Statistics, on the other hand, is about analyzing and interpreting past data to derive insights and make decisions.
The Central Limit Theorem (CLT) states that the sampling distribution of the sample mean will approach a normal distribution as the sample size increases, regardless of the population's original distribution.
Importance: It allows us to use normal distribution approximations for inferential statistics (e.g., hypothesis testing) even when the population is not normally distributed.
Tutorials
Random Blogs
- What Is SEO and Why Is It Important?
- How AI is Making Humans Weaker – The Hidden Impact of Artificial Intelligence
- Create Virtual Host for Nginx on Ubuntu (For Yii2 Basic & Advanced Templates)
- Mastering SQL in 2025: A Complete Roadmap for Beginners
- 15 Amazing Keyword Research Tools You Should Explore
- The Ultimate Guide to Starting a Career in Computer Vision
- What is YII? and How to Install it?
- Understanding LLMs (Large Language Models): The Ultimate Guide for 2025
- Understanding AI, ML, Data Science, and More: A Beginner's Guide to Choosing Your Career Path
- Datasets for analyze in Tableau


