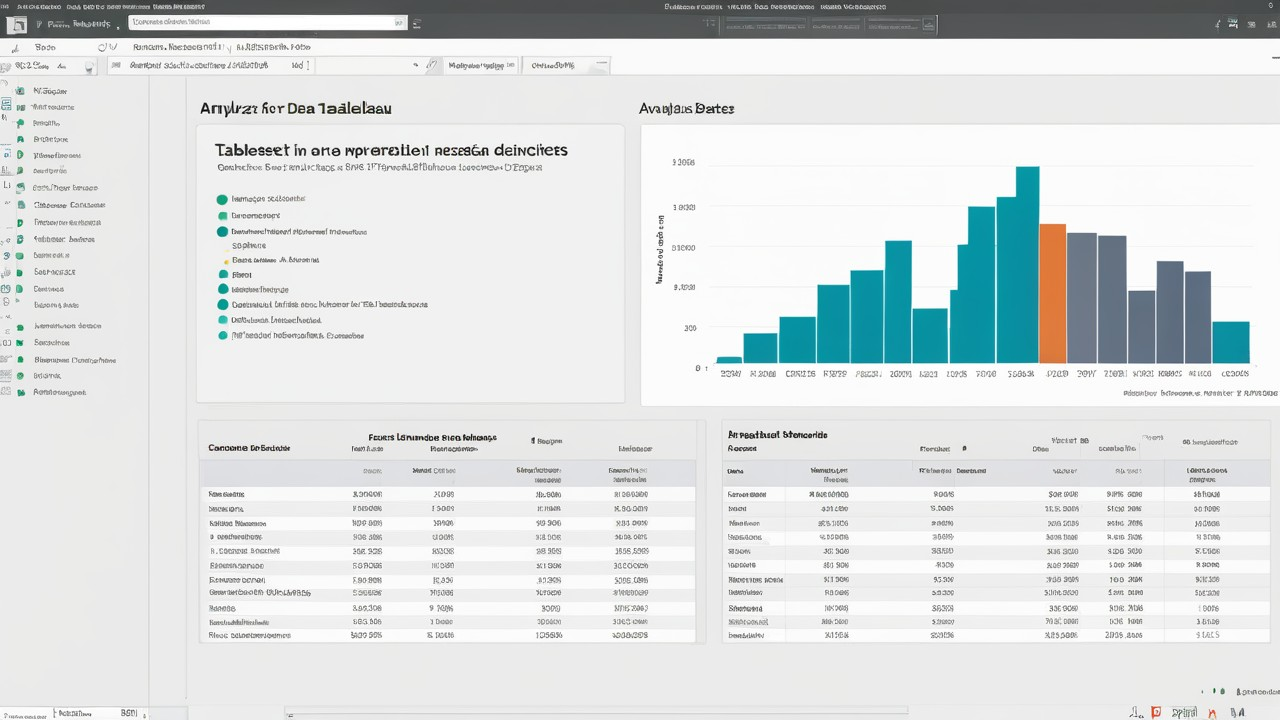
Datasets for analyze in Tableau

Hey, data is everywhere. Analyzing data outside of work can be a great way to build your skills and stretch your creative boundaries unbound from the repetition of business data.in this post, we can see 6 datasets to develop Visualizations Skills in Tableau.
1. Occupational Employment Statistics (U.S. BUREAU OF LABOR STATISTICS)
These estimates are calculated with data collected from employers in all industry sectors in metropolitan and nonmetropolitan areas in every state and the District of Columbia.
2. Crime in India Open Government Data
National Crime Records Bureau (NCRB), Govt of India has published this dataset on their website and also has shared on Open Govt Data Platform India portal under Govt. Open Data License. This dataset contains complete information about various aspects of crimes that happened in India from 2001. There are many factors that can be analyzed from this dataset. Overall, I hope this dataset helps us to understand better about India.
3. Analyzing Unemployment Status in India
Unemployment Rate in India averaged 9.21 percent from 2018 until 2020, reaching an all-time high of 23.50 percent in April of 2020 and a record low of 6.70 percent in November of 2018. Now its time to analyzing this data through visualization using Tableau.
4. Public Datasets from Tableau
Where can you find data for your next visualization project? Here are some options to get you started. Download one of the data sets below and connect to it from Tableau Desktop
5. Crude Birth Rates in Rural and Urban in India
The Crude Birth Rate (CBR) is defined as the number of live births per thousand population. It is usually the dominant factor in determining the rate of population growth. The primary source of data for births and deaths is the registration of births and deaths under the Civil Registration System (CRS) of the Office of Registrar General, India (ORGI). Download Datasets through the below link and connect to it from Tableau Desktop.
6. Novel Corona Virus (Covid-19) Dataset
Developed by the World Health Organization. Providing up to date data from around the world. Official info on COVID-19. Advice for the public. So daily level information on the affected people can give some interesting insights when it is made available to the broader data science community.
Random Blogs
- String Operations in Python
- Window Functions in SQL – The Ultimate Guide
- Convert RBG Image to Gray Scale Image Using CV2
- Downlaod Youtube Video in Any Format Using Python Pytube Library
- Loan Default Prediction Project Using Machine Learning
- Role of Digital Marketing Services to Uplift Online business of Company and Beat Its Competitors
- Important Mistakes to Avoid While Advertising on Facebook
- AI in Cybersecurity: The Future of Digital Protection
- Compiler SQL Online: A Beginner-Friendly Guide to Running SQL Queries Anywhere
- Big Data: The Future of Data-Driven Decision Making
Prepare for Interview
- JavaScript Interview Questions for 5+ Years Experience
- JavaScript Interview Questions for 2–5 Years Experience
- JavaScript Interview Questions for 1–2 Years Experience
- JavaScript Interview Questions for 0–1 Year Experience
- JavaScript Interview Questions For Fresher
- SQL Interview Questions for 5+ Years Experience
- SQL Interview Questions for 2–5 Years Experience
- SQL Interview Questions for 1–2 Years Experience
- SQL Interview Questions for 0–1 Year Experience
- SQL Interview Questions for Freshers
- Design Patterns in Python
Datasets for Machine Learning
- Awesome-ChatGPT-Prompts
- Amazon Product Reviews Dataset
- Ozone Level Detection Dataset
- Bank Transaction Fraud Detection
- YouTube Trending Video Dataset (updated daily)
- Covid-19 Case Surveillance Public Use Dataset
- US Election 2020
- Forest Fires Dataset
- Mobile Robots Dataset
- Safety Helmet Detection
- All Space Missions from 1957
- OSIC Pulmonary Fibrosis Progression Dataset
- Wine Quality Dataset
- Google Audio Dataset
- Iris flower dataset
- Artificial Characters Dataset
- Bitcoin Heist Ransomware Address Dataset
